We have been in COVID-19 lockdown for a whole year. Holy moly! I feel like I quantum tunneled from last March until now. This blows my mind—I feel like it has been forever, and at the same time, no time at all.
More than anything, I have learned that I really, really love walking. I spend all day parked in front of my computer in my living room. I sleep 20 feet behind me. I cook meals 10 feet to my right. I am intertly trapped in these walls.
When I first moved to Berkeley in 2018, I was bored one day and decided to walk just around the neighborhood. “This is so weird!” I remember thinking. “Who takes walks for fun? Walking is a means of transportation, not an activity!”
I don’t think I’ve so dramatically changed my mind on anything.
Going for a good medium-length walk has been my ‘anchoring vignette’ of the pandemic. I try and do it every day. More than two days without walking and I feel it: I don’t sleep right, I’m eating like garbage, I’m anxious and antsy.
Quite literally, walking keeps me sane.
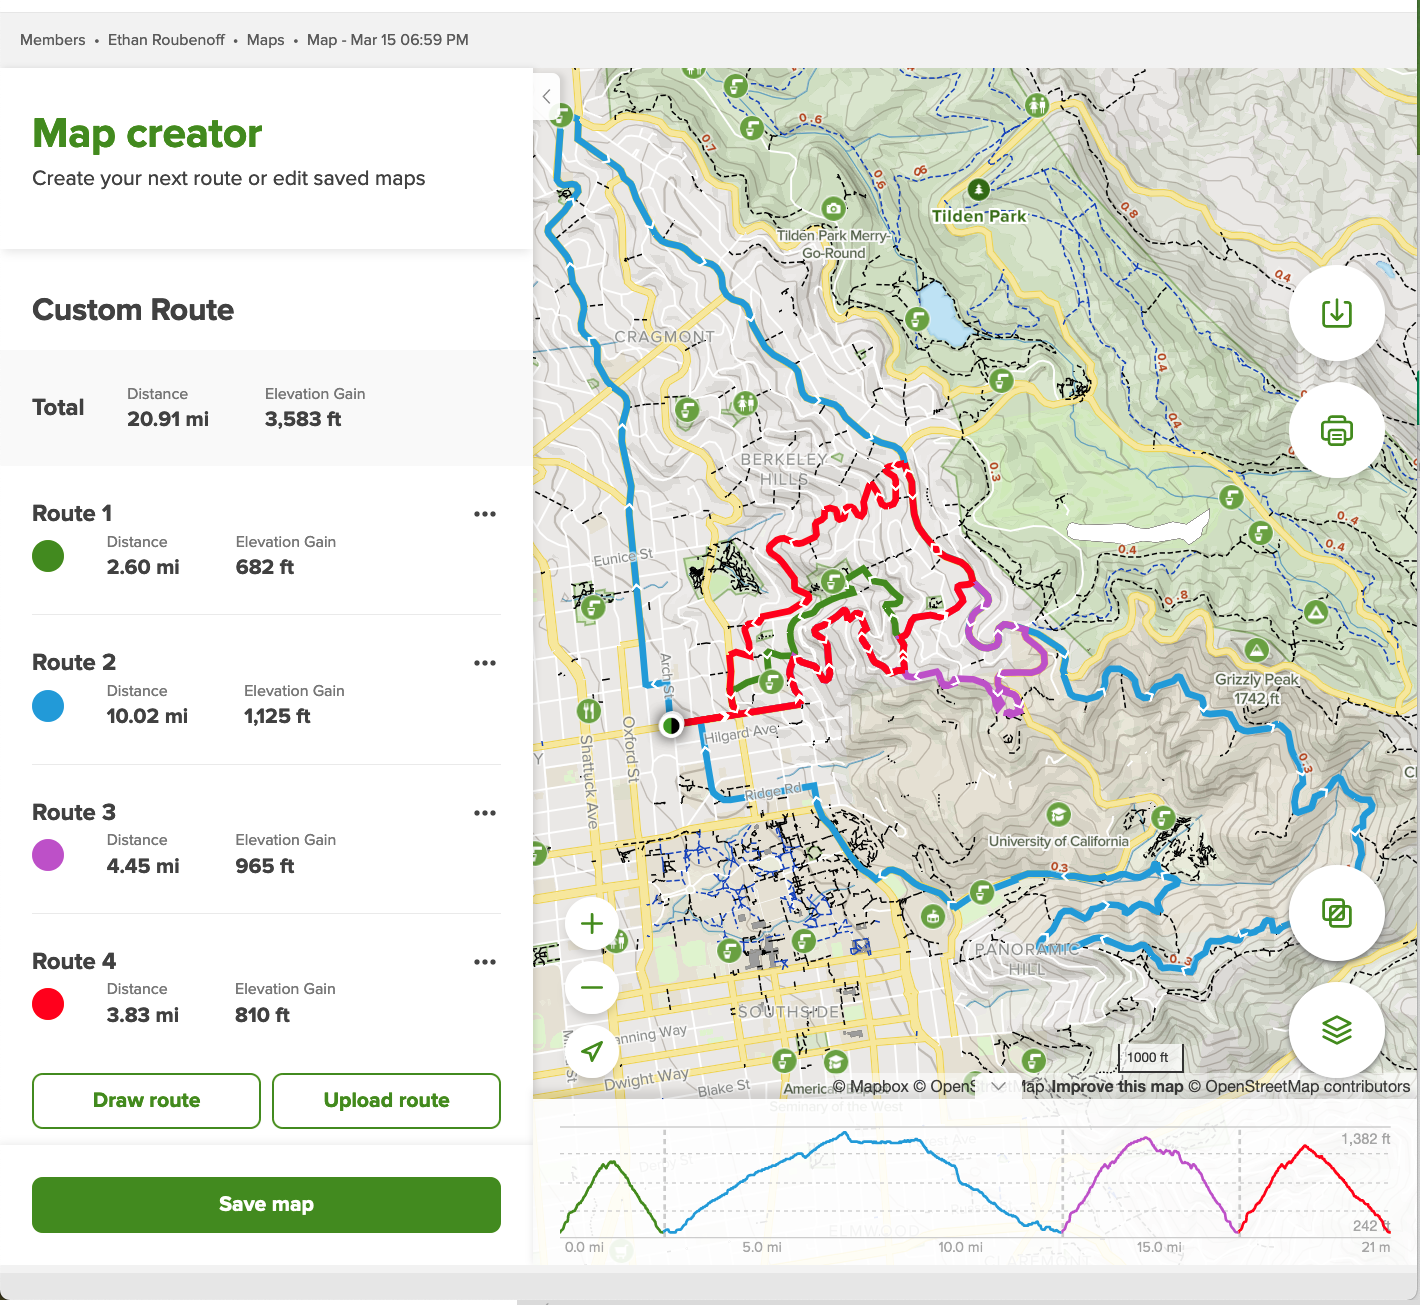
It took some experimentation but I settled on a good 4-ish mile loop. I live at the base of the Berkeley hills and walk as directly up the hill as possible. I try to really push myself here: brisk pace, heart rate up. At the top, I take a lazy, winding path down. The whole thing takes exactly and hour and a half.
It’s a little hard to see because of the way Alltrails does feature layering, but my main walks are red and purple; green is the “short” version and blue is “I have the whole afternoon off” version. (I started and stopped not exactly at my apartment, for privacy, I guess.)
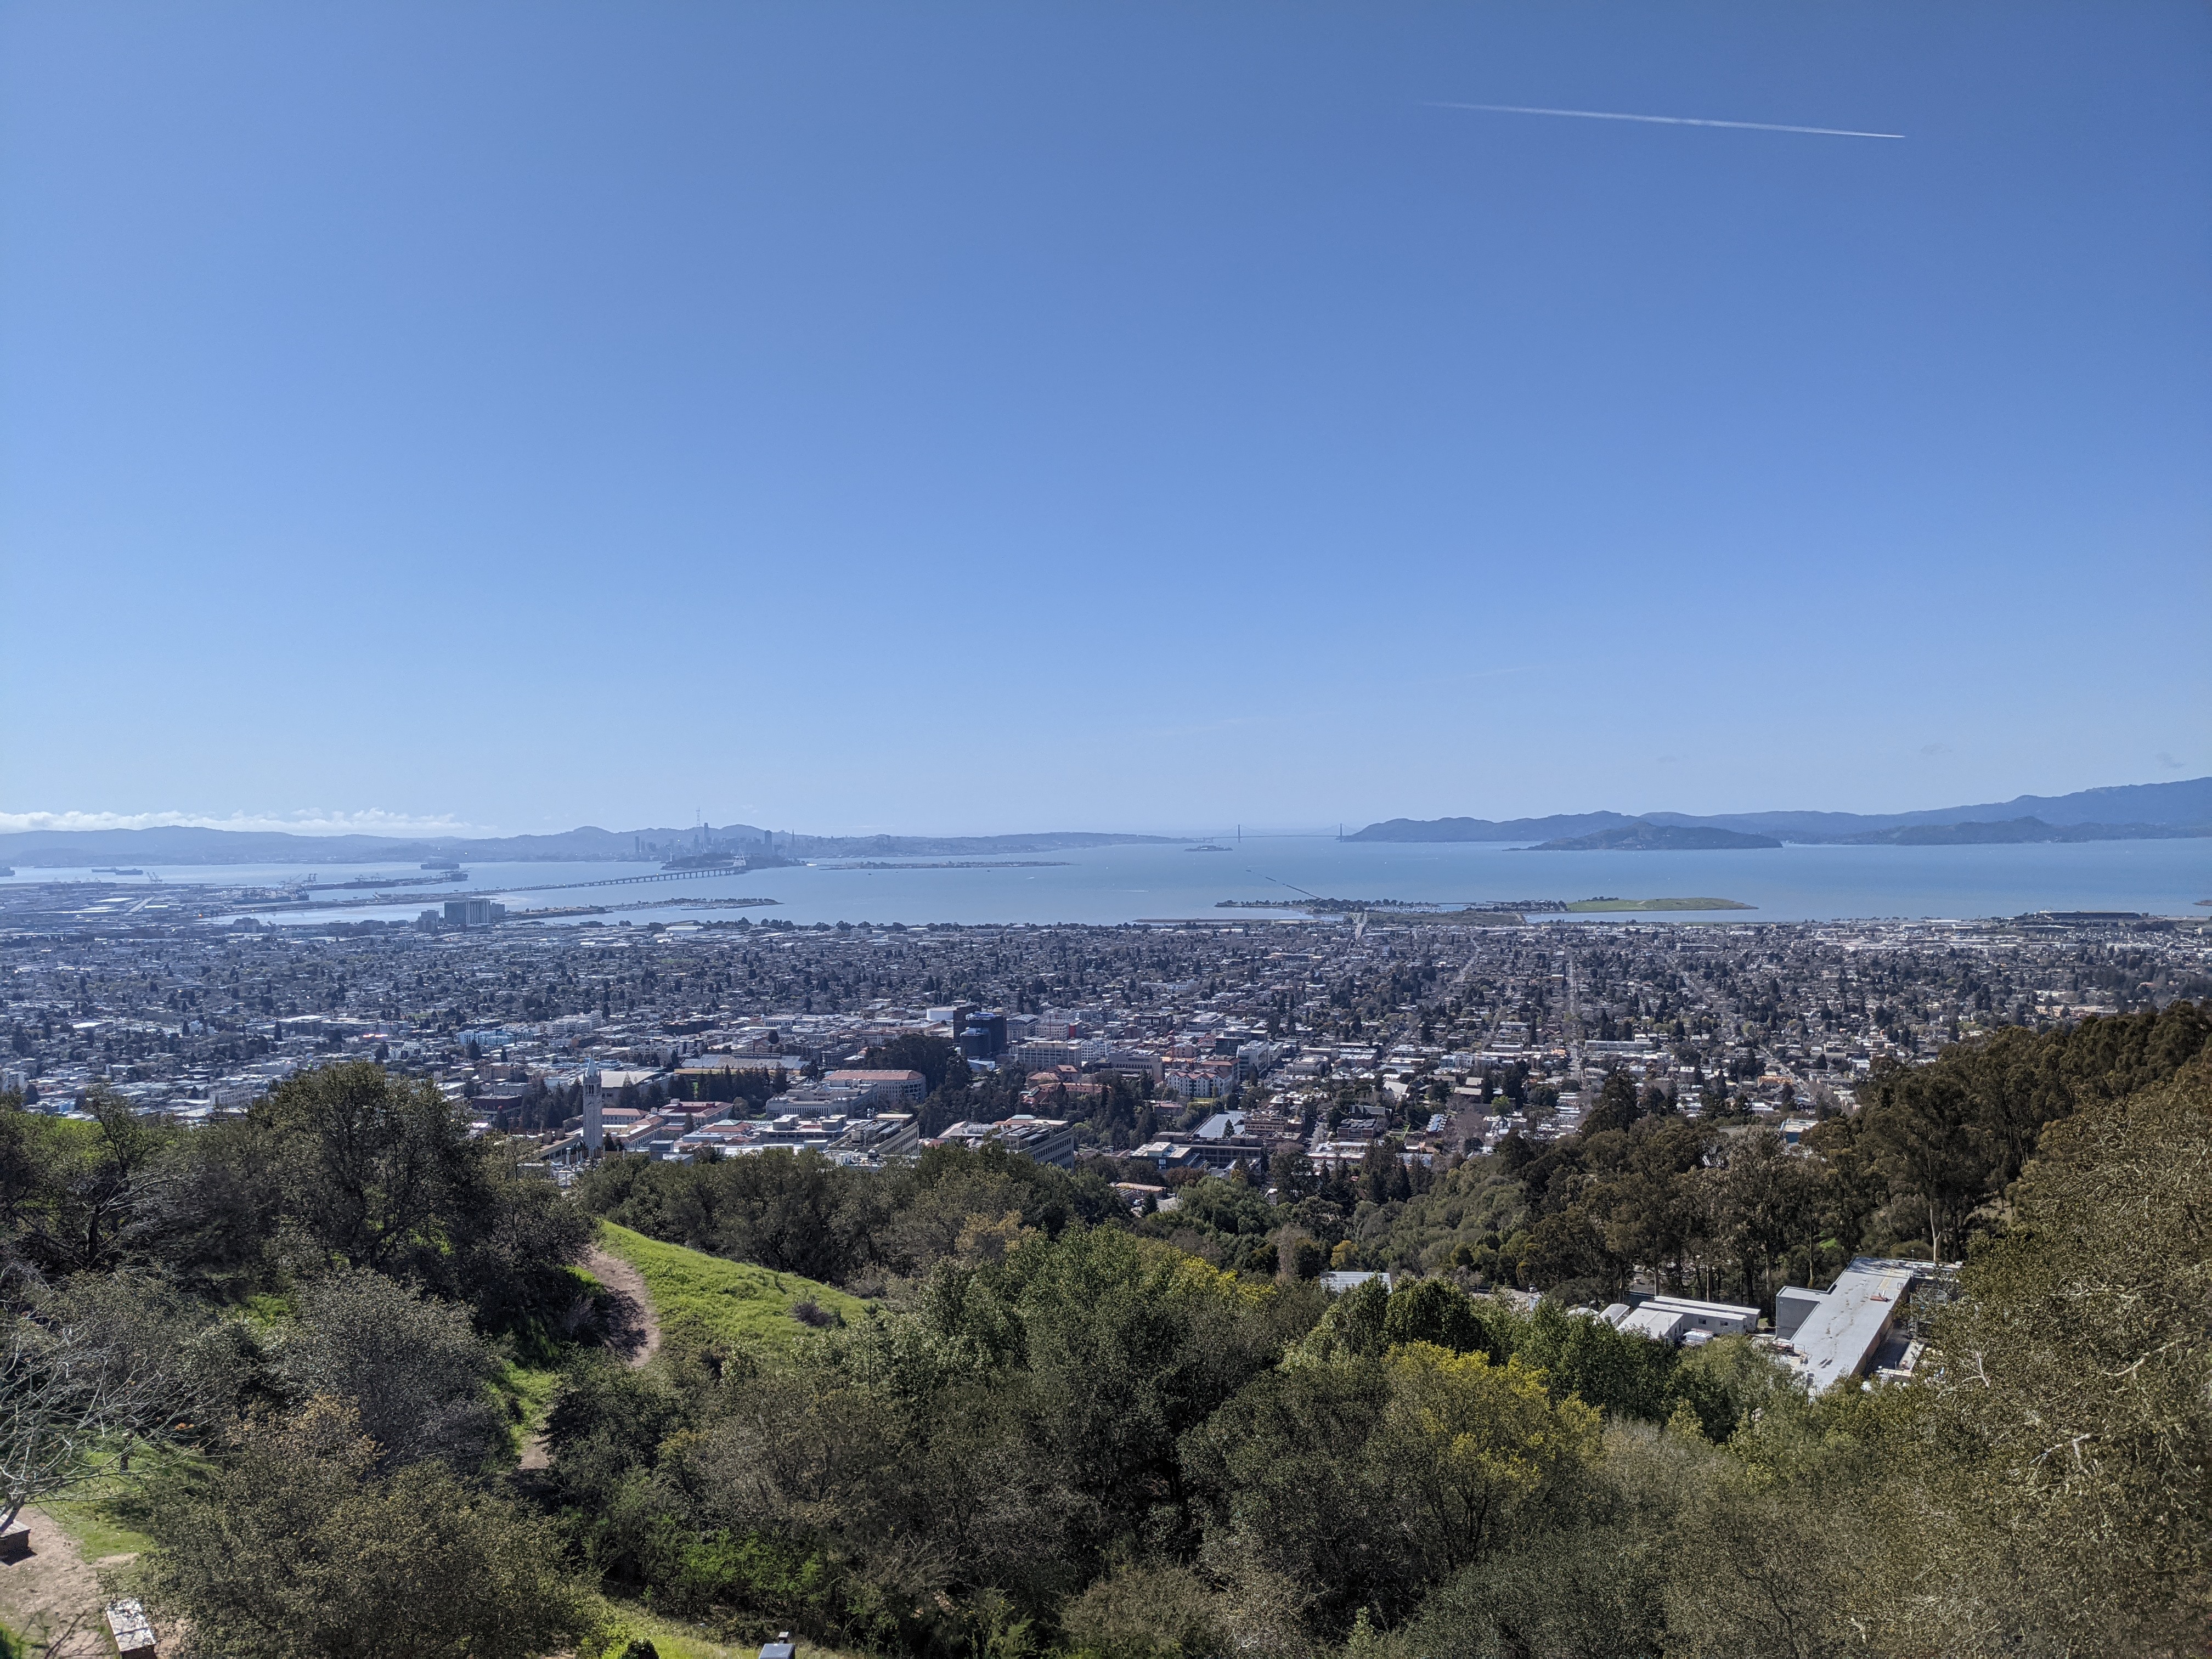
Here’s the view from Lawrence Hall of Science (The top of the purple
route). You can see my apartment in here, actually.
If you have an Android phone, Google tracks your location always (“Timeline”). This is a little spooky from a cybersecurity and data ethics perspective, but I think it’s kind of neat to be able to look back on where I’ve been. You can download your data from Google Takeout. I selected “Fit” (walking and tracking data) and “Timeline” (KML shapefiles).
Let’s start with the Fit data:
daily_activity_metrics <- read_csv(
  "./Takeout 2/Fit/Daily activity metrics/Daily activity metrics.csv",
  col_types = cols()
  )
head(daily_activity_metrics)

## # A tibble: 6 x 36
##   Date       `Average weight… `Max weight (kg… `Min weight (kg… `Calories (kcal…
##   <date>                <dbl>            <dbl>            <dbl>            <dbl>
## 1 2019-06-19             NA               NA               NA               880.
## 2 2019-06-20             NA               NA               NA              1549.
## 3 2019-06-21             NA               NA               NA                NA
## 4 2019-06-22             NA               NA               NA               818.
## 5 2019-06-23             NA               NA               NA              1579.
## 6 2019-06-24             77.5             77.5             77.5            2032.
## # … with 31 more variables: `Heart Points` <dbl>, `Heart Minutes` <dbl>, `Low
## #   latitude (deg)` <dbl>, `Low longitude (deg)` <dbl>, `High latitude
## #   (deg)` <dbl>, `High longitude (deg)` <dbl>, `Average heart rate
## #   (bpm)` <dbl>, `Max heart rate (bpm)` <dbl>, `Min heart rate (bpm)` <dbl>,
## #   `Step count` <dbl>, `Distance (m)` <dbl>, `Average speed (m/s)` <dbl>, `Max
## #   speed (m/s)` <dbl>, `Min speed (m/s)` <dbl>, `Move Minutes count` <dbl>,
## #   `Biking duration (ms)` <dbl>, `Inactive duration (ms)` <dbl>, `Walking
## #   duration (ms)` <dbl>, `Running duration (ms)` <dbl>, `Basketball duration
## #   (ms)` <dbl>, `Stationary biking duration (ms)` <dbl>, `Hiking duration
## #   (ms)` <dbl>, `Hockey duration (ms)` <dbl>, `Jogging duration (ms)` <dbl>,
## #   `Sleep duration (ms)` <dbl>, `Swimming duration (ms)` <dbl>, `Other
## #   duration (ms)` <dbl>, `Light sleeping duration (ms)` <dbl>, `Deep sleeping
## #   duration (ms)` <dbl>, `REM sleeping duration (ms)` <dbl>, `Awake
## #   mid-sleeping duration (ms)` <dbl>
There’s a lot of information here, and most of it isn’t super useful. Let’s pull some cols after the lockdown began (March 16th, 2020 for me)
daily_activity_metrics <- daily_activity_metrics %>%
  filter(lubridate::as_date(Date) >= lubridate::as_date("2020-03-16")) %>%
  select(Date,
         kcal  = `Calories (kcal)`,
         steps = `Step count`,
         distance = `Distance (m)`,
         move_mins = `Move Minutes count`,
         walking_duration = `Walking duration (ms)`) %>%
  drop_na()
head(daily_activity_metrics)

## # A tibble: 6 x 6
##   Date        kcal steps distance move_mins walking_duration
##   <date>     <dbl> <dbl>    <dbl>     <dbl>            <dbl>
## 1 2020-03-16 1891. 10032    5388.        94          4951858
## 2 2020-03-17 1826.  9057    4548.        89          3917920
## 3 2020-03-18 1582.  2268    1043.        22            70473
## 4 2020-03-19 1943. 12953    7208.       137          5765957
## 5 2020-03-20 2222.  1895   22351.       172           134521
## 6 2020-03-21 1746.  3228    1377.        70           409769
First, let’s look at steps:
ggplot(daily_activity_metrics) +
  geom_point(aes(Date, steps))
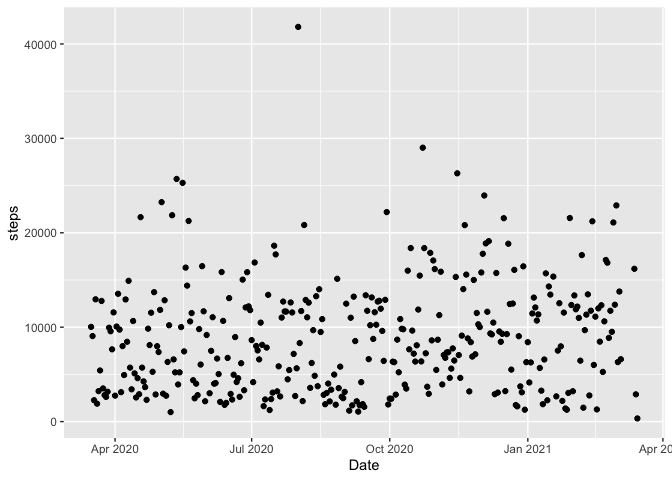
I think that high point in July was hiking Cloud’s rest in Yosemite.
And then distance:
ggplot(daily_activity_metrics) +
  geom_point(aes(Date, distance))
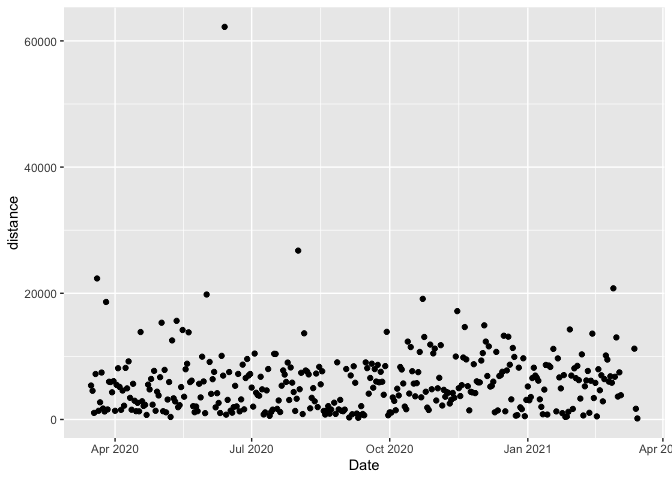
I have no idea what this 60-km walk was…. likely something weird with GPS (sometimes it thinks that I was walking when I was actually just driving really slowly).
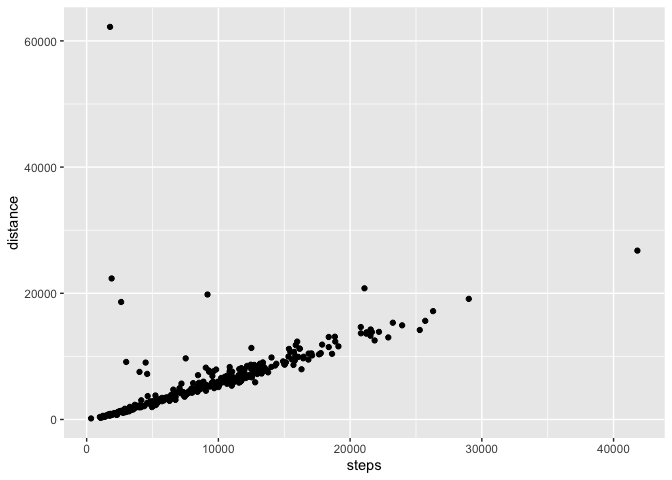
There’s naturally a pretty strong correlation between distance and steps:
ggplot(daily_activity_metrics) +
  geom_point(aes(steps, distance))
summary(lm(distance~steps, data = daily_activity_metrics))

##
## Call:
## lm(formula = distance ~ steps, data = daily_activity_metrics)
##
## Residuals:
##    Min     1Q Median     3Q    Max
##  -2146   -855   -666   -165  60681
##
## Coefficients:
##              Estimate Std. Error t value Pr(>|t|)
## (Intercept) 495.00110  368.67460   1.343     0.18
## steps         0.58932    0.03454  17.063   <2e-16 ***
## ---
## Signif. codes:  0 '***' 0.001 '**' 0.01 '*' 0.05 '.' 0.1 ' ' 1
##
## Residual standard error: 3796 on 350 degrees of freedom
## Multiple R-squared:  0.4541, Adjusted R-squared:  0.4525
## F-statistic: 291.1 on 1 and 350 DF,  p-value: < 2.2e-16
This estimates one of my steps as being approximately 0.58 meters, or 1.9 feet. I’m about 5’5 (on a good day): according to this probably not very accurate table, my stride length should be 27”, which is slightly too long. I have short legs, I guess!
Out of pure interest, calories:
ggplot(daily_activity_metrics) +
  geom_point(aes(Date, kcal))
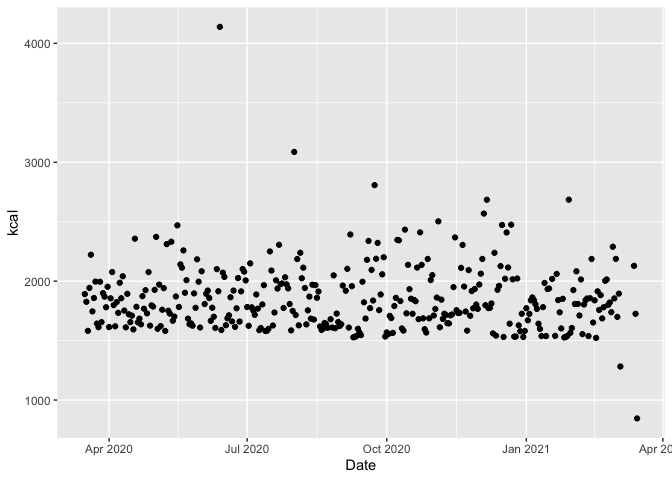
Funny: the last dot is below 1000 calories: that’s probably today, when it’s still morning and I haven’t gone outside yet! Funny.
I have reason to think that there is one anomaly (oh! I think I went biking that day). I’m going to filter that one out:
daily_activity_metrics <- daily_activity_metrics %>%
  filter(distance < 60000)
Sum it up and convert to miles:
sum(daily_activity_metrics$distance)/1609

## [1] 1220.033
Holy moly! 1,220 miles I’ve walked in a year! That’s nuts, man. That’s about 3.3 per day, which is consistent with my normal walk (between 3-4 miles), but obviously I did a little more some days and took a few off.